Fisherman Feedback Tool
The Council uses its Fisherman Feedback tool to gather information from fishermen about what is happening on-the-water. The Council solicits input for the fish species it manages ahead of each scientific stock assessment. The information provided is analyzed and delivered to the scientists and managers to help to inform their current understanding of each fish stock. To learn more, click on the infographic at right and read the completed report summaries below.
The collection of this Fisherman Feedback information is authorized under the OMB Control Number included in the Citizen Science & Crowdsourcing Information Collection page.

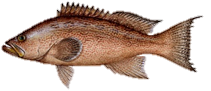
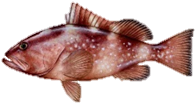
The Gulf Council is currently seeking Fisherman Feedback for Red Grouper
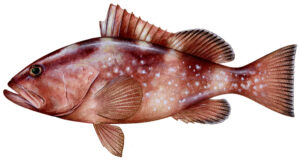
A scientific stock assessment of red grouper is currently underway. We rely on your on-the-water expertise to guide our current understanding of what’s happening.The information you provide through our Fisherman Feedback Tool will help to inform scientists and managers as they formulate a current understanding of the red grouper stock.
Please submit your responses to our Fisherman Feedback for Red Grouper Tool by 5:00 PM, EDT on May 24, 2024.
Summary Reports
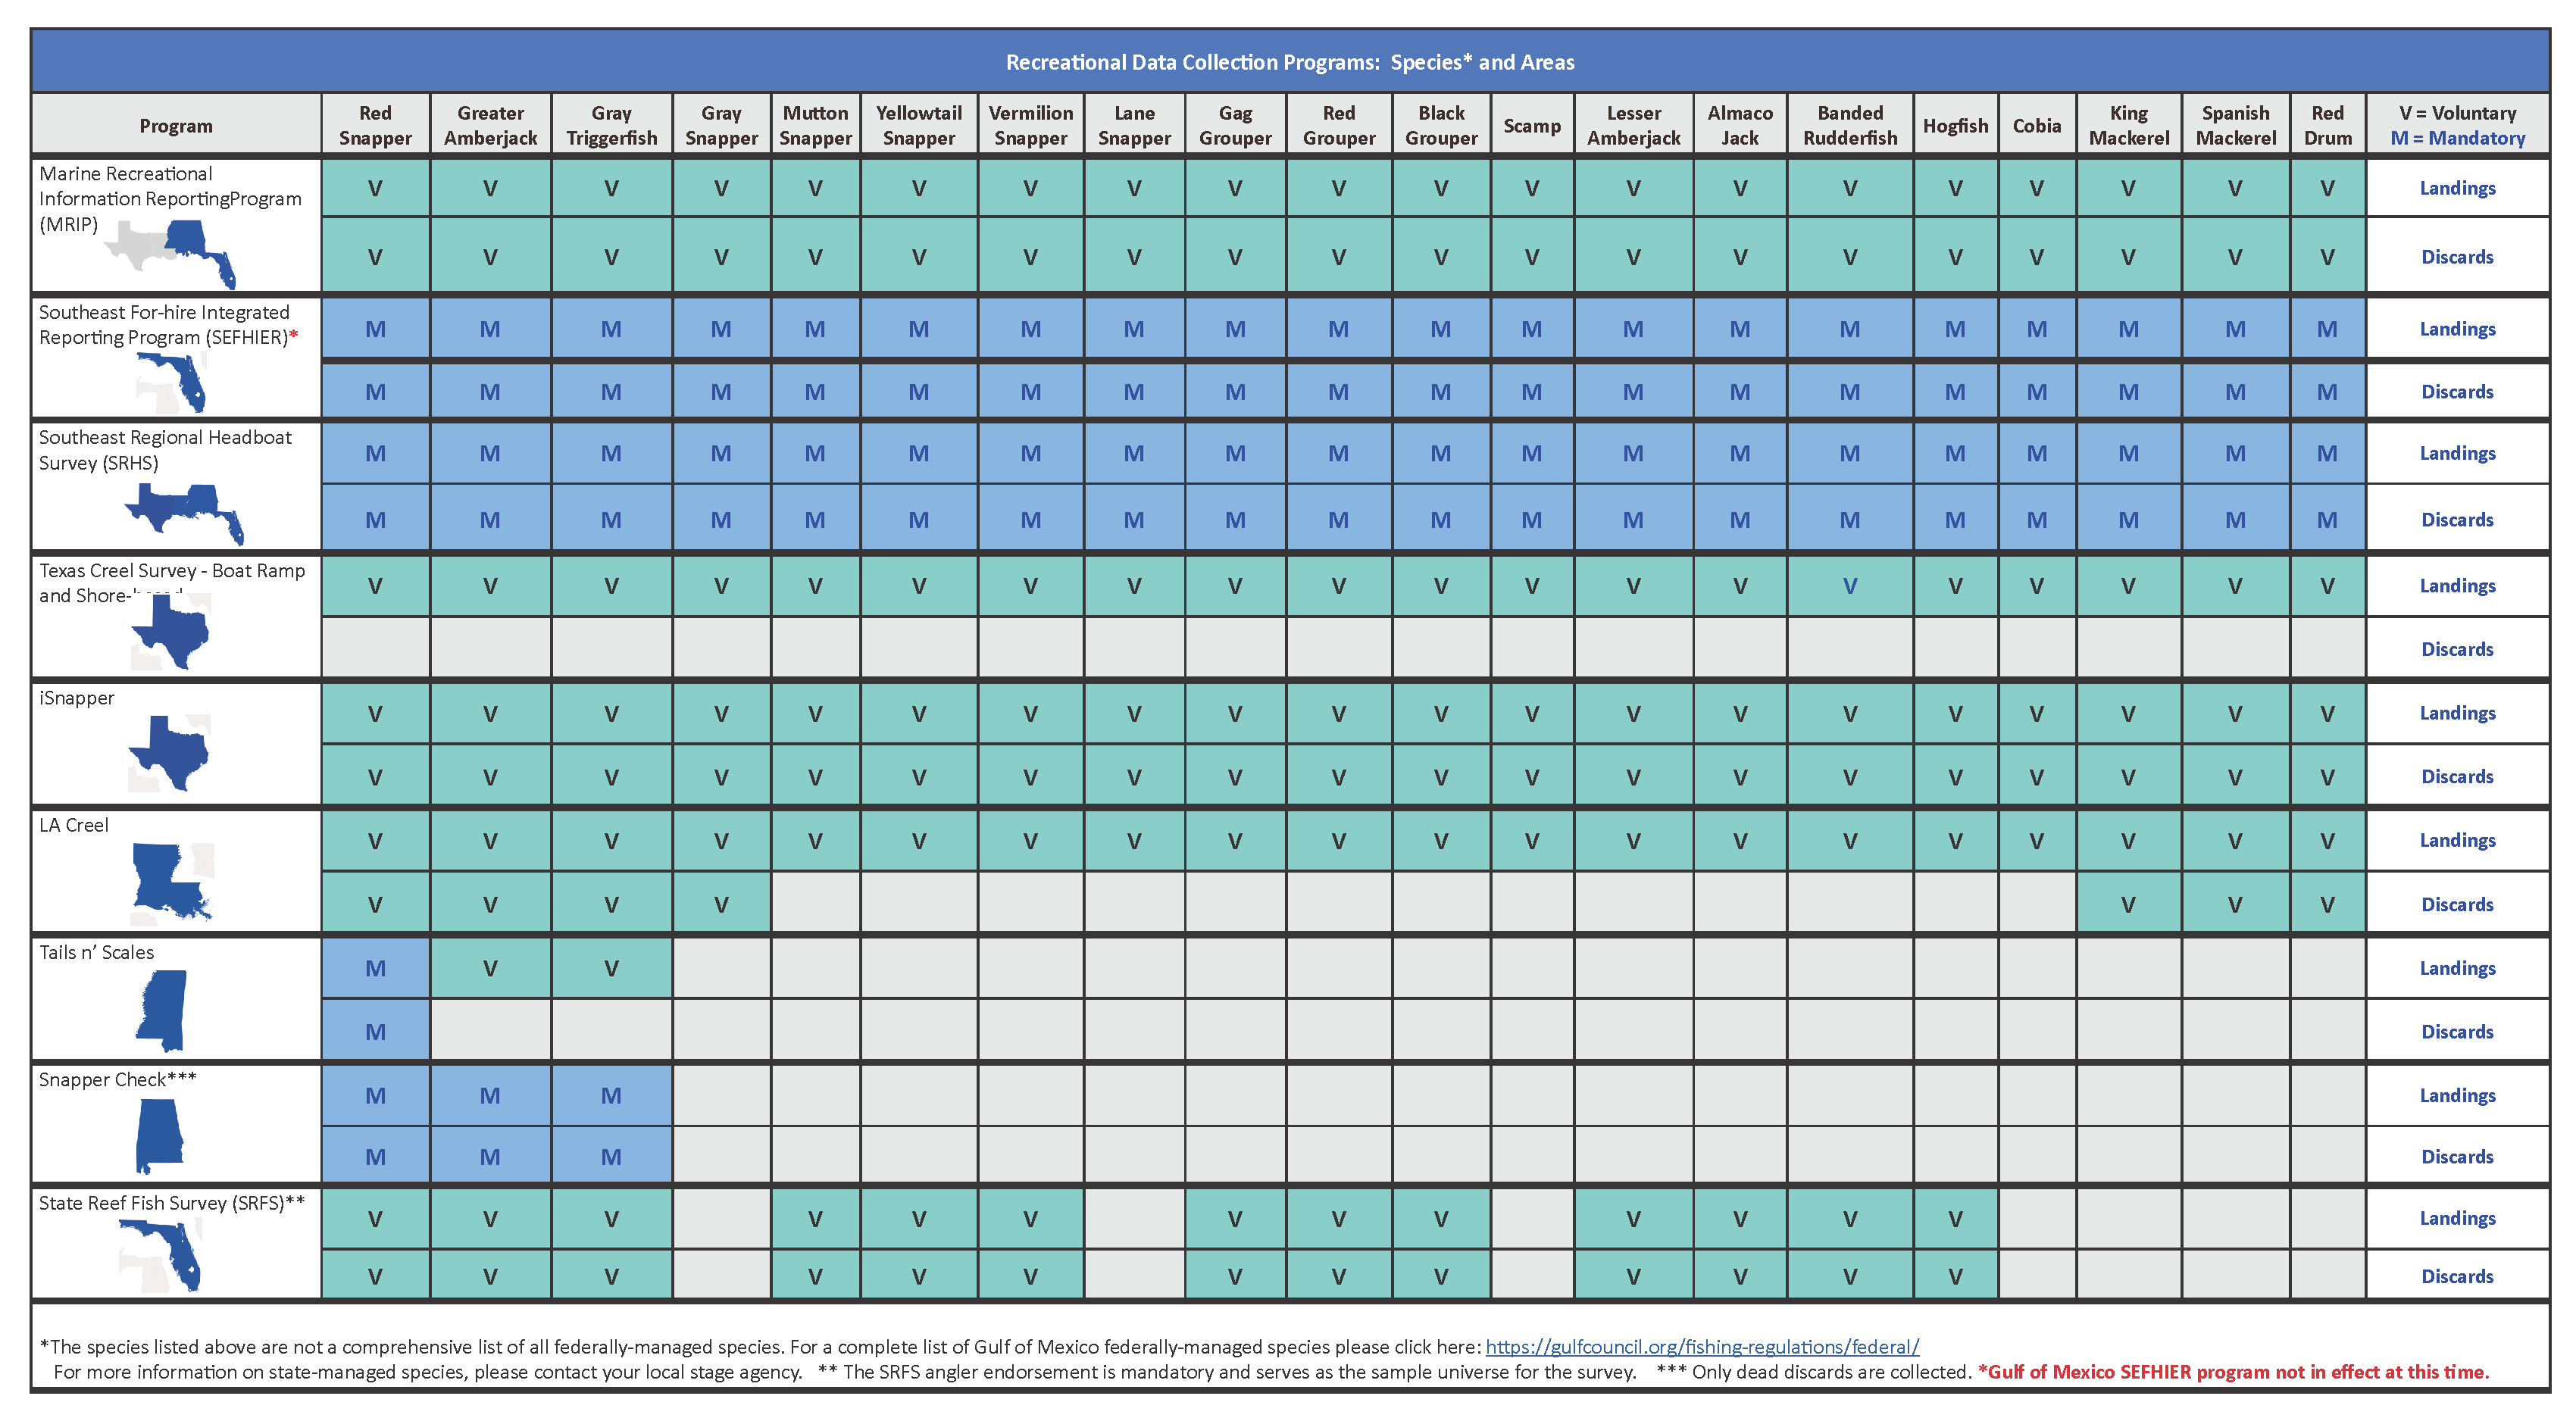
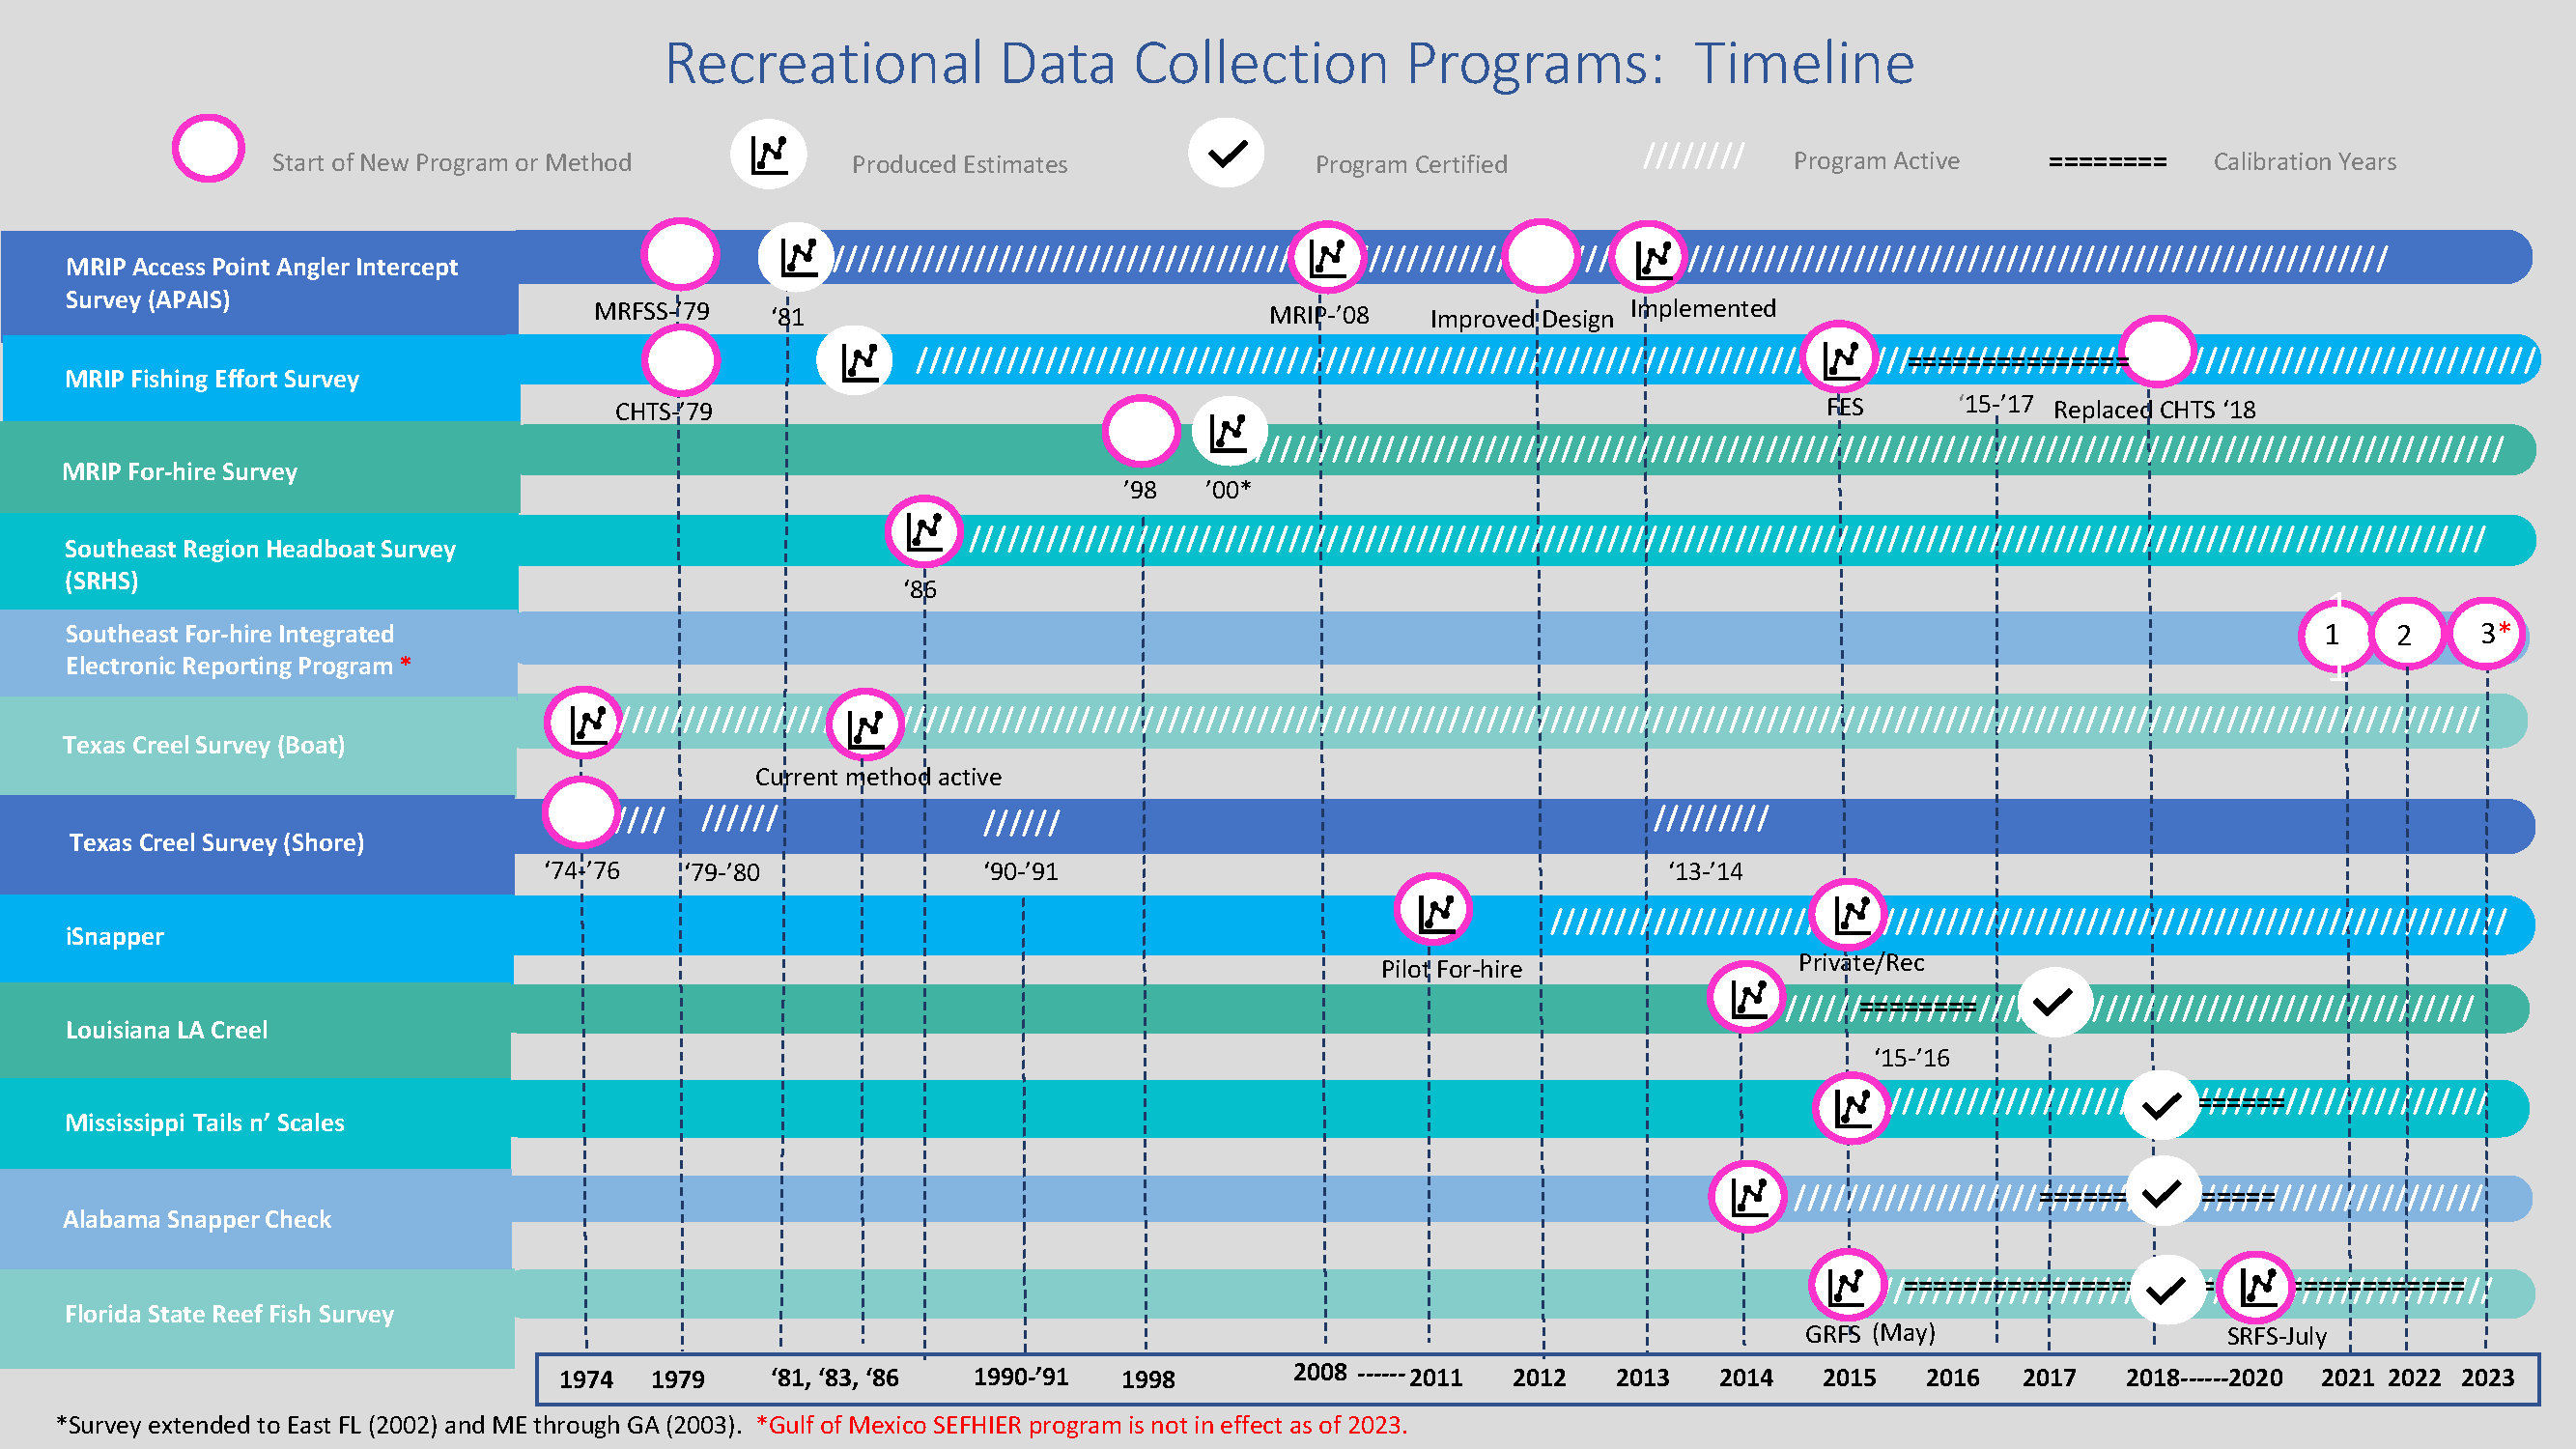
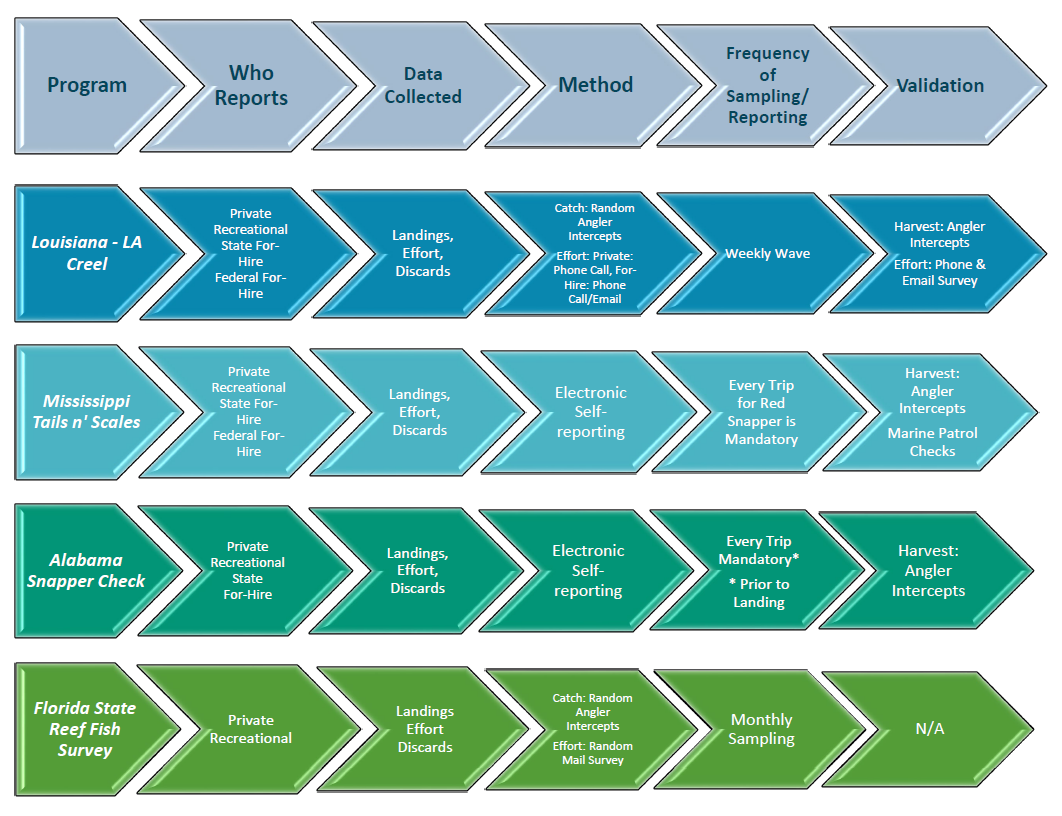
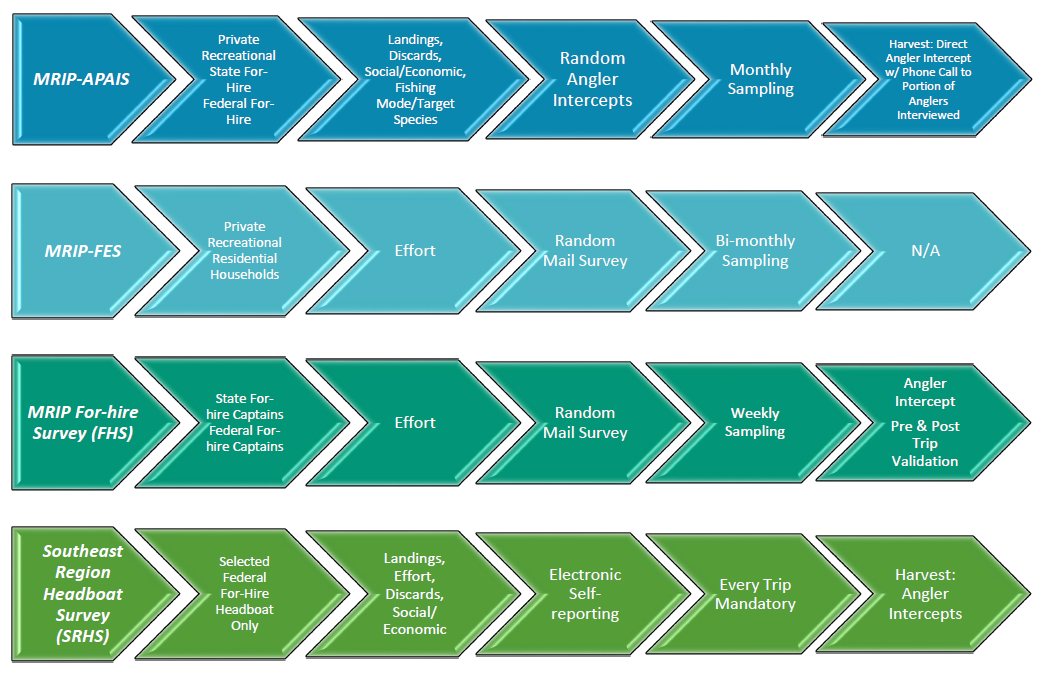
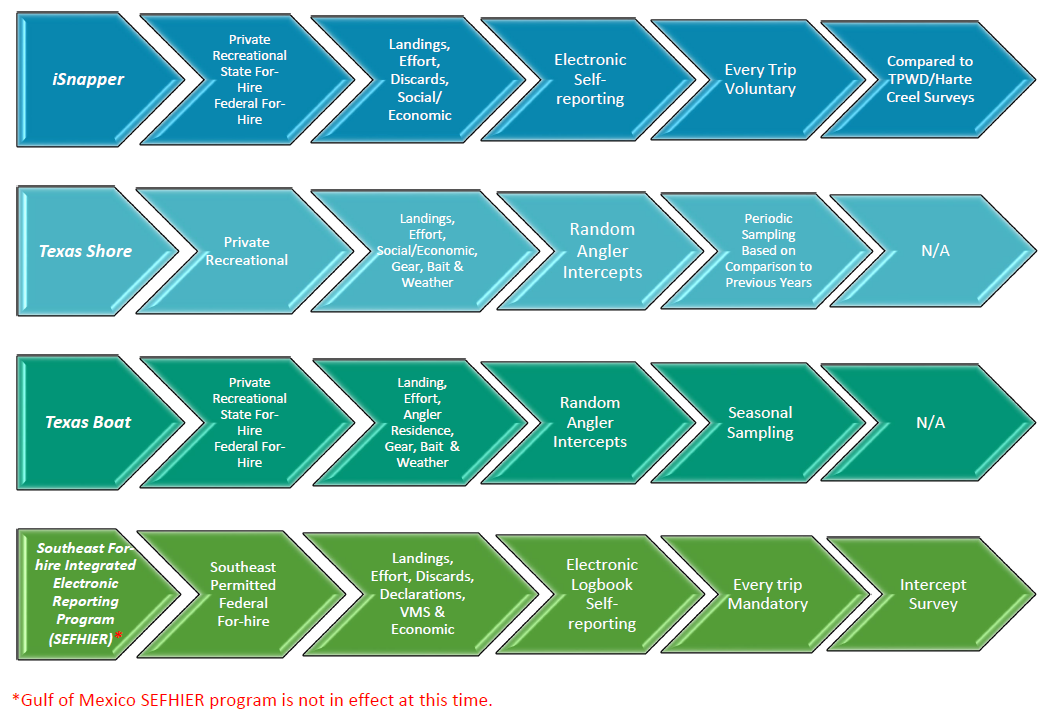
Recreational Data Collection Programs
There are numerous recreational data collection programs across the Gulf that contribute to our understanding of recreational fishing effort and catch. The methodologies, species, area, and temporal coverage of these programs vary. The infographics below outline the differences and similarities of each program.
Data Currencies by Species
Click anywhere in table to interact.
Species and Areas
Timeline
Methods
Recreational Data Collection Programs: Methods
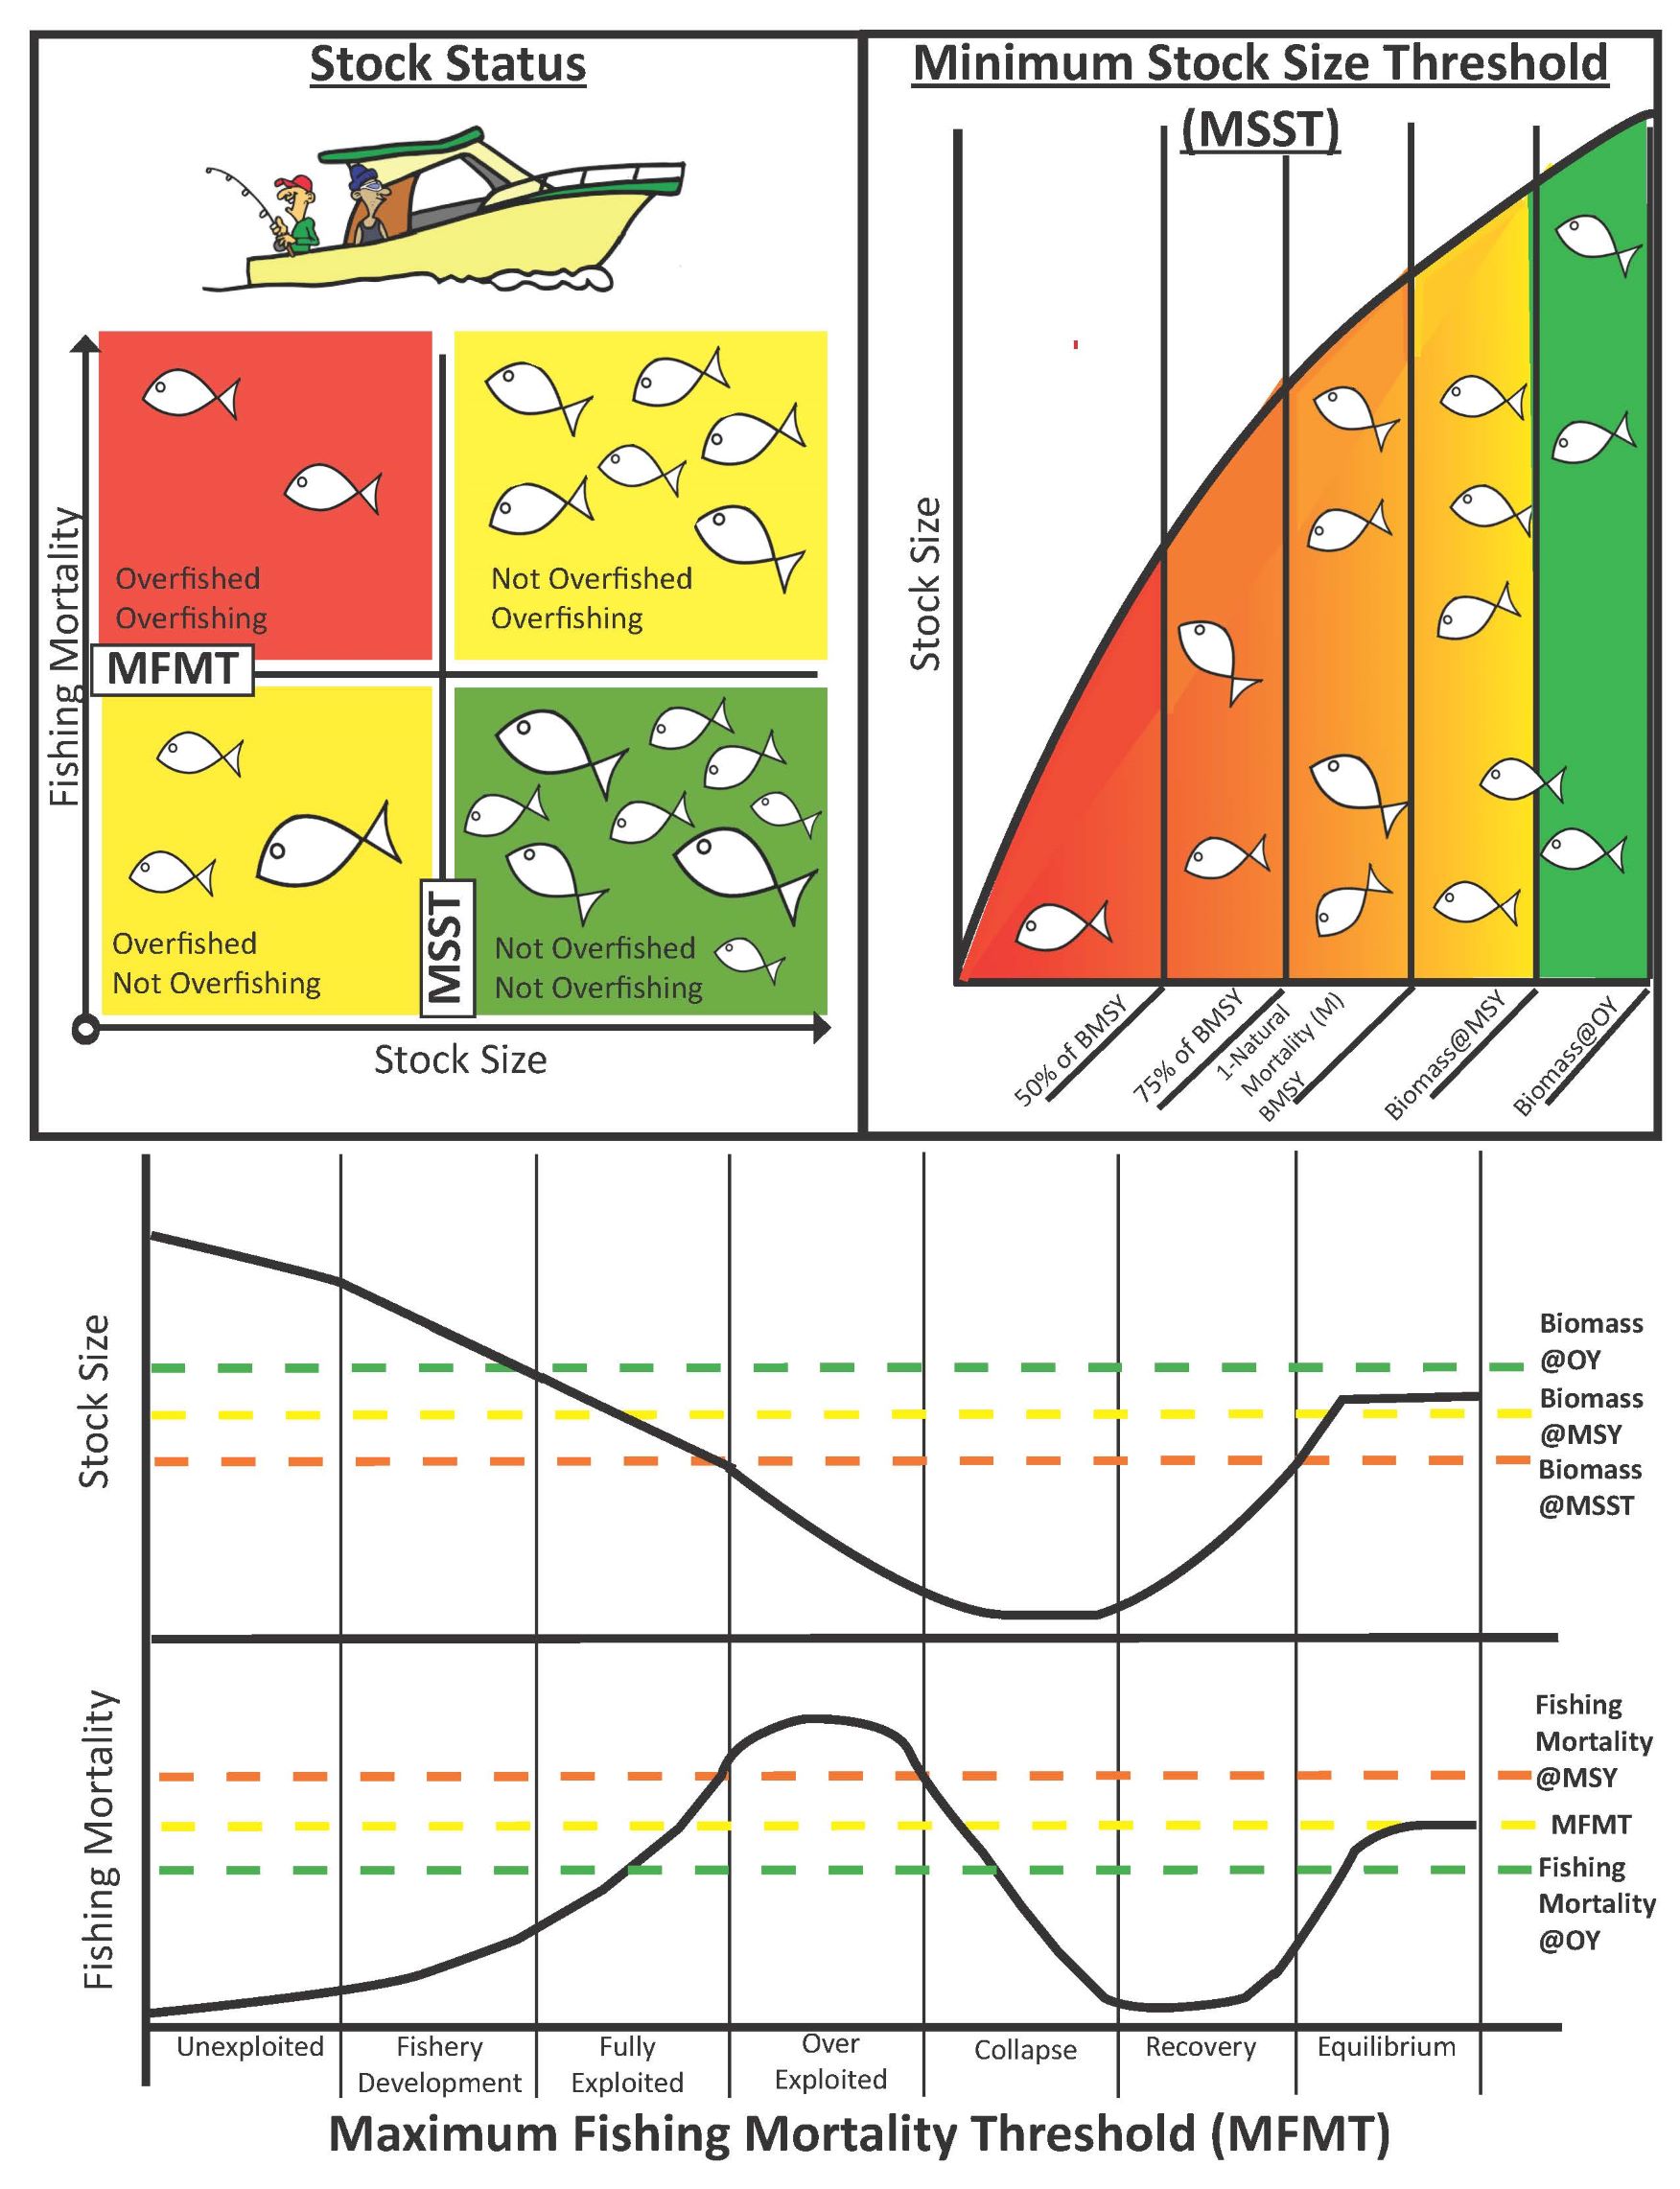
Status Determination Criteria Infographic
The Council must use objective and measurable criteria to determine overfishing and overfished status for each stock. Collectively, the values used to determine stock status are referred to as status determination criteria.
Status Determination Criteria Definitions
| Maximum Sustainable Yield Proxy (MSY)
The largest long-term average catch, or yield that can be taken from a stock or stock complex each year on a continuing basis under prevailing conditions (ecological, environmental, fishery characteristic). MSY can rarely be calculated with accuracy, so a proxy that can be more readily calculated and represents a sustainable level of harvest is usually used.
|
|
FMSY The rate of fishing mortality that, if applied over the long term, would result in catching the MSY.
|
|
BMSY The long-term average size of the stock or stock complex that would be achieved by fishing at a constant fishing mortality rate equal to FMSY. It can be measured in terms of spawning biomass or other appropriate measure of the stock’s reproductive potential.
|
|
Minimum Stock Size Threshold (MSST) The biomass level that a stock can decline to before being declared overfished (stock abundance is too low) and requiring a rebuilding plan. It can be no lower than 50% of the BMSY.
|
|
Maximum Fishing Mortality Threshold (MFMT) Maximum fishing mortality threshold (MFMT) is the rate of fishing mortality above which a stock is declared to be experiencing overfishing (fish are being removed at too rapid a rate). MFMT may not exceed FMSY.
|
|
Optimum Yield (OY) Optimum yield (OY) is a level of harvest that will provide the greatest overall benefit to the Nation, and is based on MSY as reduced by any relevant economic, social, or ecological factor. It takes the protection of marine ecosystems into account and, in the case of an overfished fishery, provides for rebuilding to a level consistent with producing the MSY or MSY proxy.
|
|
Spawning Potential Ratio (SPR) Sawning potential ratio (SPR) assumes that a certain amount of fish must survive and spawn in order to replenish the stock. It is calculated as the average number of eggs per fish over its lifetime when the stock is fished compared to the average number of eggs per fish over its lifetime when the stock is not fished.
|
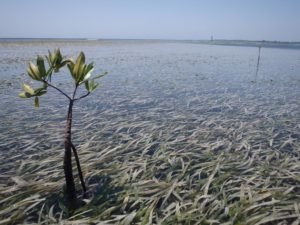
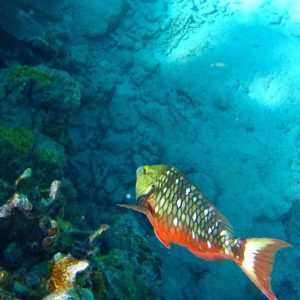
Gulf of Mexico Ecosystem Science
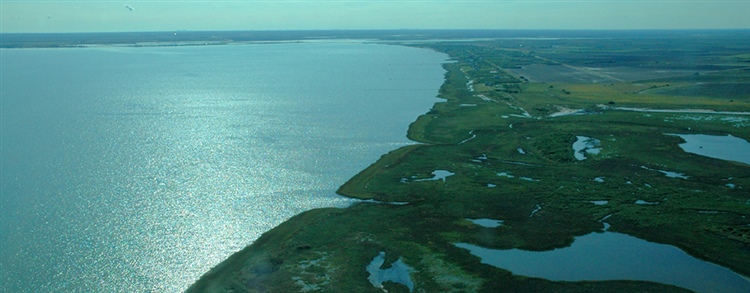
An ecosystem is defined as a biological community of interacting organisms and their surrounding environment. Effective fisheries management requires a broad understanding of how each species interacts with other living organisms, the physical environment, and humans (social and economic implications). Ecosystem Status Reports provide the Council with a snapshot of the status, trends, and possible future conditions of key components of an ecosystem including sea surface temperature, the status of fish populations, revenue from tourism, and more. Currently, these Status Reports are used to incorporate ecosystem considerations into fishery management plans and stock assessments. This ensures that management decisions consider a holistic understanding of each species. The Council is working to develop a Fishery Ecosystem Plan that creates a blueprint outlining how to continue incorporating ecosystem considerations into its fishery management process.